Claude HUD Gives Claude Code the Instrument Panel It Always Needed
A zero-dependency statusline plugin that shows context health, tool activity, running agents, and rate limit consumption without leaving your terminal.
- Claude HUD uses the native statusline API to show context window health, tool activity, agent status, and todo progress directly below your Claude Code input.
- The plugin reads from three data sources (stdin JSON, transcript JSONL, and the Anthropic usage API) with zero external dependencies and updates every 300 milliseconds.
- Rate limit visibility for Pro, Max, and Team plans turns surprise session resets into predictable, manageable events.
- At 5,800+ stars and 259 forks in under three months, Claude HUD has become the default observability layer for serious Claude Code users.
The Problem Nobody Talked About
Claude Code is powerful. You fire it up, describe what you want, and watch it read files, write code, run tests, and spawn subagents. The terminal fills with activity. And then, without warning, the context window fills up.
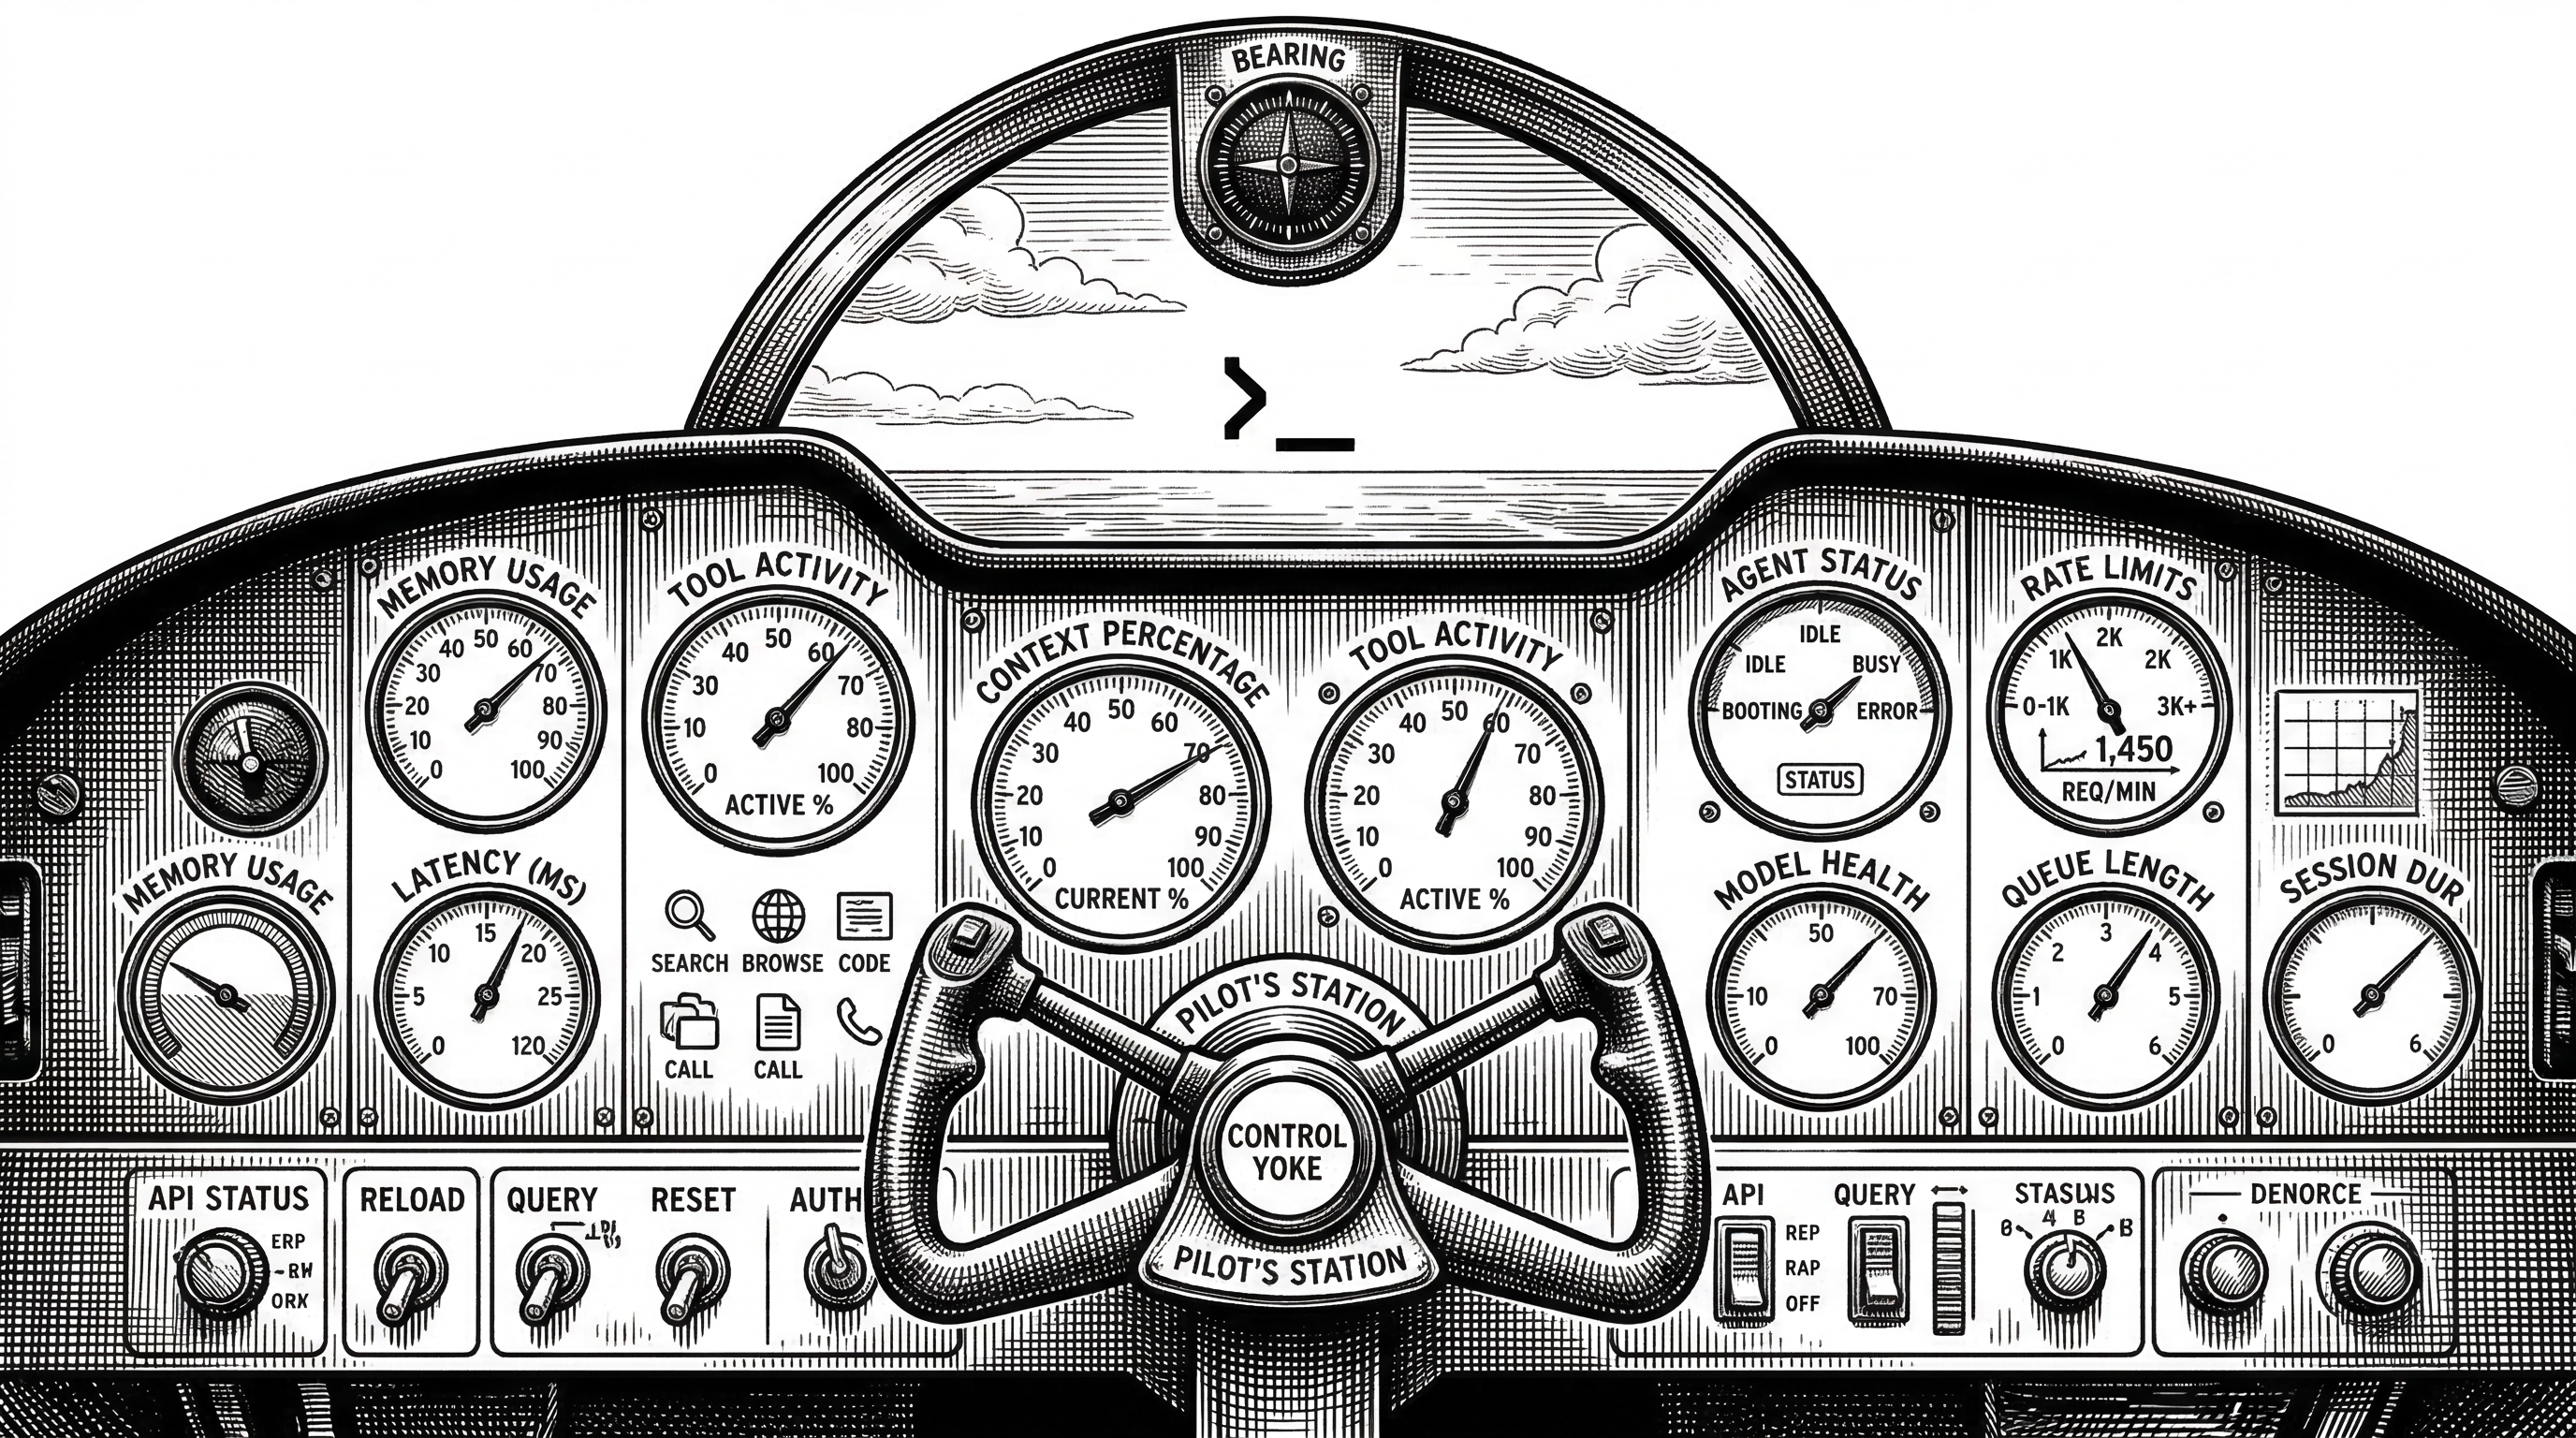
There is no built-in fuel gauge. No speedometer. No dashboard telling you how much runway you have left. You find out your context is exhausted the same way you find out you are out of gas on the highway: by stopping.
The rate limits are worse. Pro and Max subscribers get rolling 5-hour and 7-day windows. But the only way to check consumption is to visit the web dashboard or wait for the "you've been rate limited" message. By then you have lost your flow.

Three Commands to Visibility
Jarrod Watts, an Australian developer known for his web3 work at thirdweb and Abstract, built Claude HUD to solve this exact problem. Installation takes three steps inside any Claude Code session.
/plugin marketplace add jarrodwatts/claude-hud
/plugin install claude-hud
/claude-hud:setup
No restart. No separate terminal. No tmux. The HUD appears immediately below your Claude Code input line and stays there.
That zero-dependency count is worth highlighting. The entire plugin is TypeScript compiled to JavaScript, running on Node 18+. No npm install cascade. No version conflicts. It reads stdin, parses files, makes one API call, and writes to stdout. That is the entire runtime.
What the Statusline Shows
The default display is two lines. Line one shows the model name, your plan tier (Max, Pro, or Bedrock), the project directory, and the git branch with dirty state. Line two shows a color-coded context bar and your usage rate limit consumption.
[Opus | Max] | my-project git:(main*)
Context █████░░░░░ 45% | Usage ██░░░░░░░░ 25% (1h 30m / 5h)
The context bar transitions from green to yellow at 60% and from yellow to red at 85%. These are the moments when you should consider summarizing or starting a new session. Having the number visible at all times changes how you work.
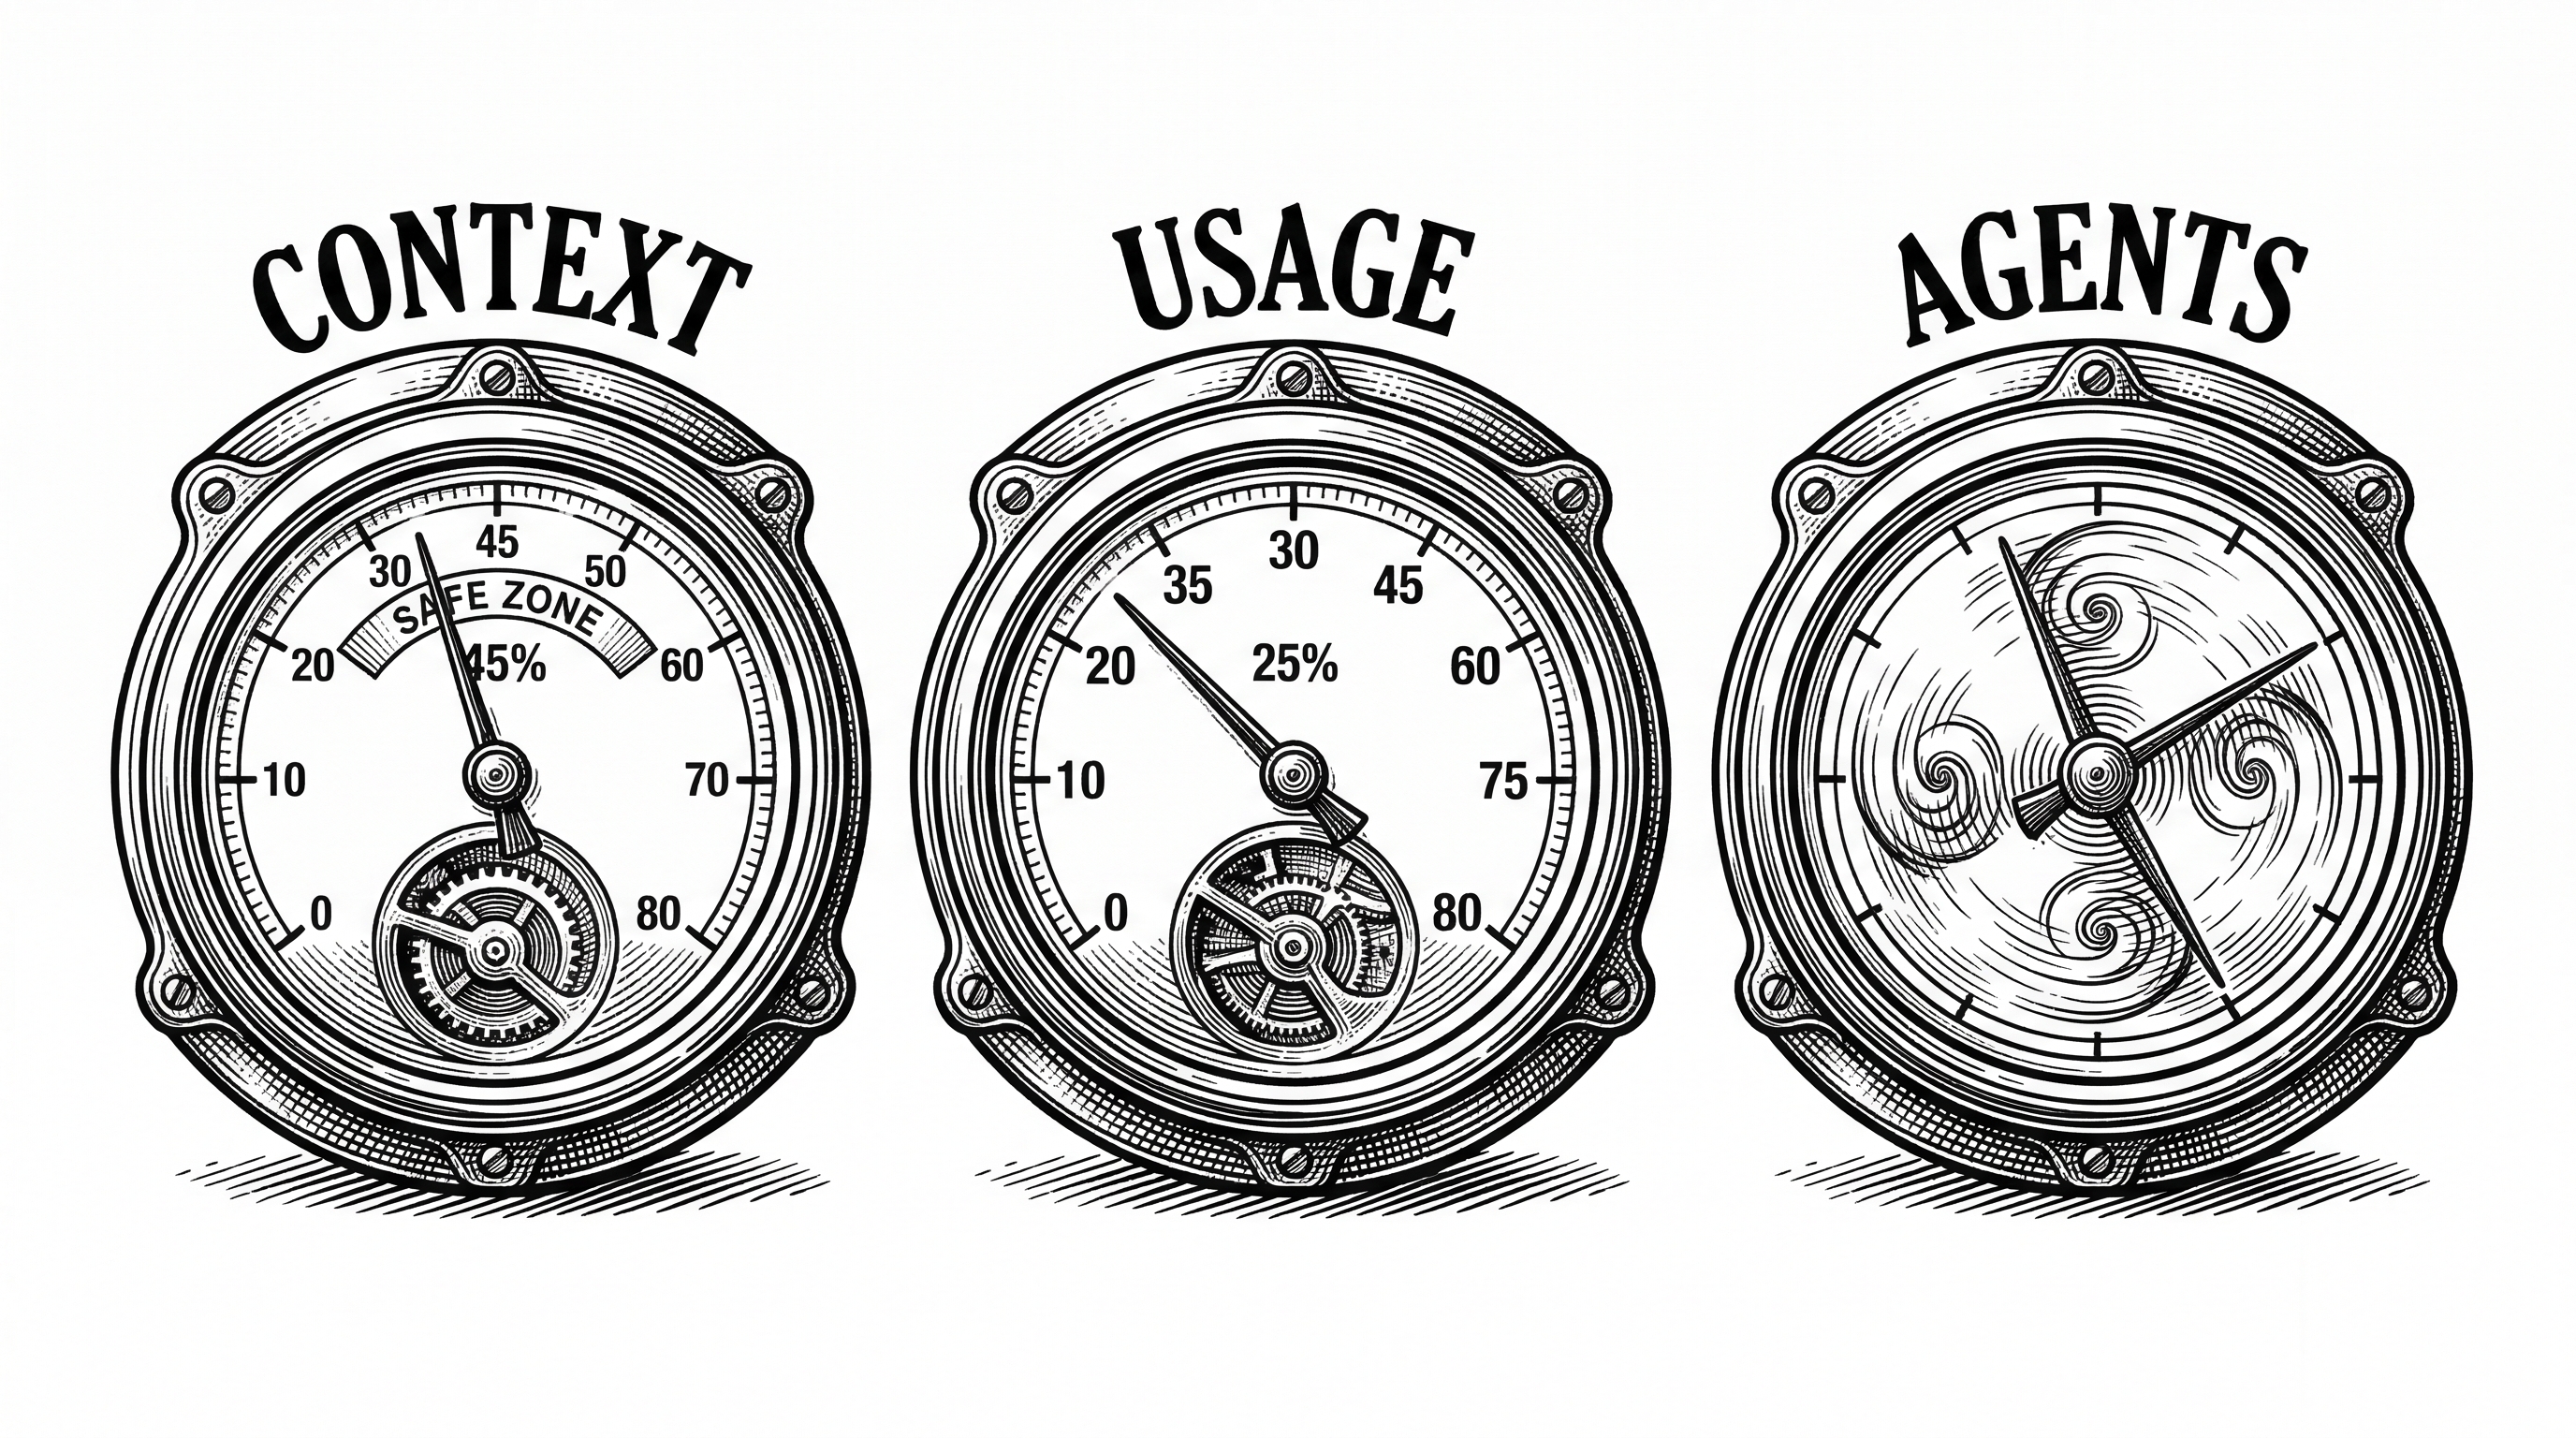
Enable the optional lines and the HUD gets richer. A tools activity line shows what Claude is doing right now. An agents line tracks subagent spawns and their duration. A todos line shows task completion progress from TodoWrite calls.
◐ Edit: auth.ts | ✓ Read x3 | ✓ Grep x2
◐ explore [haiku]: Finding auth code (2m 15s)
▸ Fix authentication bug (2/5)
Each of these is a toggle. You pick exactly what you want to see. The /claude-hud:configure command walks you through it interactively, with a live preview before you save.
The Three Data Sources
Understanding how Claude HUD works requires understanding where its data comes from. There are three inputs, and each tells a different part of the story.
stdin JSON: the heartbeat
Every 300 milliseconds, Claude Code pipes a JSON object to the plugin's stdin. This object carries the model name, context window size, current token usage (input, output, cache creation, cache read), the working directory, and the transcript file path.
This is not estimated data. It comes directly from Claude Code's internal state. When Claude Code reports that you have used 45% of your context, that is the real number. The HUD scales correctly whether you have a 200k context window or a 1M context session.
Transcript JSONL: the activity log
Claude Code writes a line-delimited JSON file logging every message exchange. Each line records tool_use events (with the tool name, target file, and input), tool_result events (with success/error status), Task spawns for subagents, and TodoWrite calls for task tracking.
The parseTranscript() function streams this file, maintaining maps of active tools and agents. It keeps the last 20 tool entries and 10 agent entries, providing a rolling window of activity without unbounded memory growth.
Anthropic Usage API: the rate limit oracle
For Pro, Max, and Team subscribers, the plugin reads OAuth credentials from the macOS Keychain (or a credentials file on Linux) and calls the Anthropic usage endpoint. The response includes 5-hour and 7-day utilization percentages plus reset timestamps.
This is where the engineering gets careful. The HUD runs as a fresh process every 300ms. There is no persistent in-memory state. So usage responses are cached to disk with configurable TTL. Rate-limited (429) responses trigger exponential backoff. Stale cache values remain visible while the background refreshes. Lock files prevent concurrent API calls from racing.
"Introducing Claude HUD! A Claude Code plugin that shows you: context remaining in the session, what tools are executing, which subagents are running, claude's to-do list progress."
Inside the Architecture
The codebase is compact and well-organized. The src/ directory contains 14 TypeScript files, each with a clear responsibility.
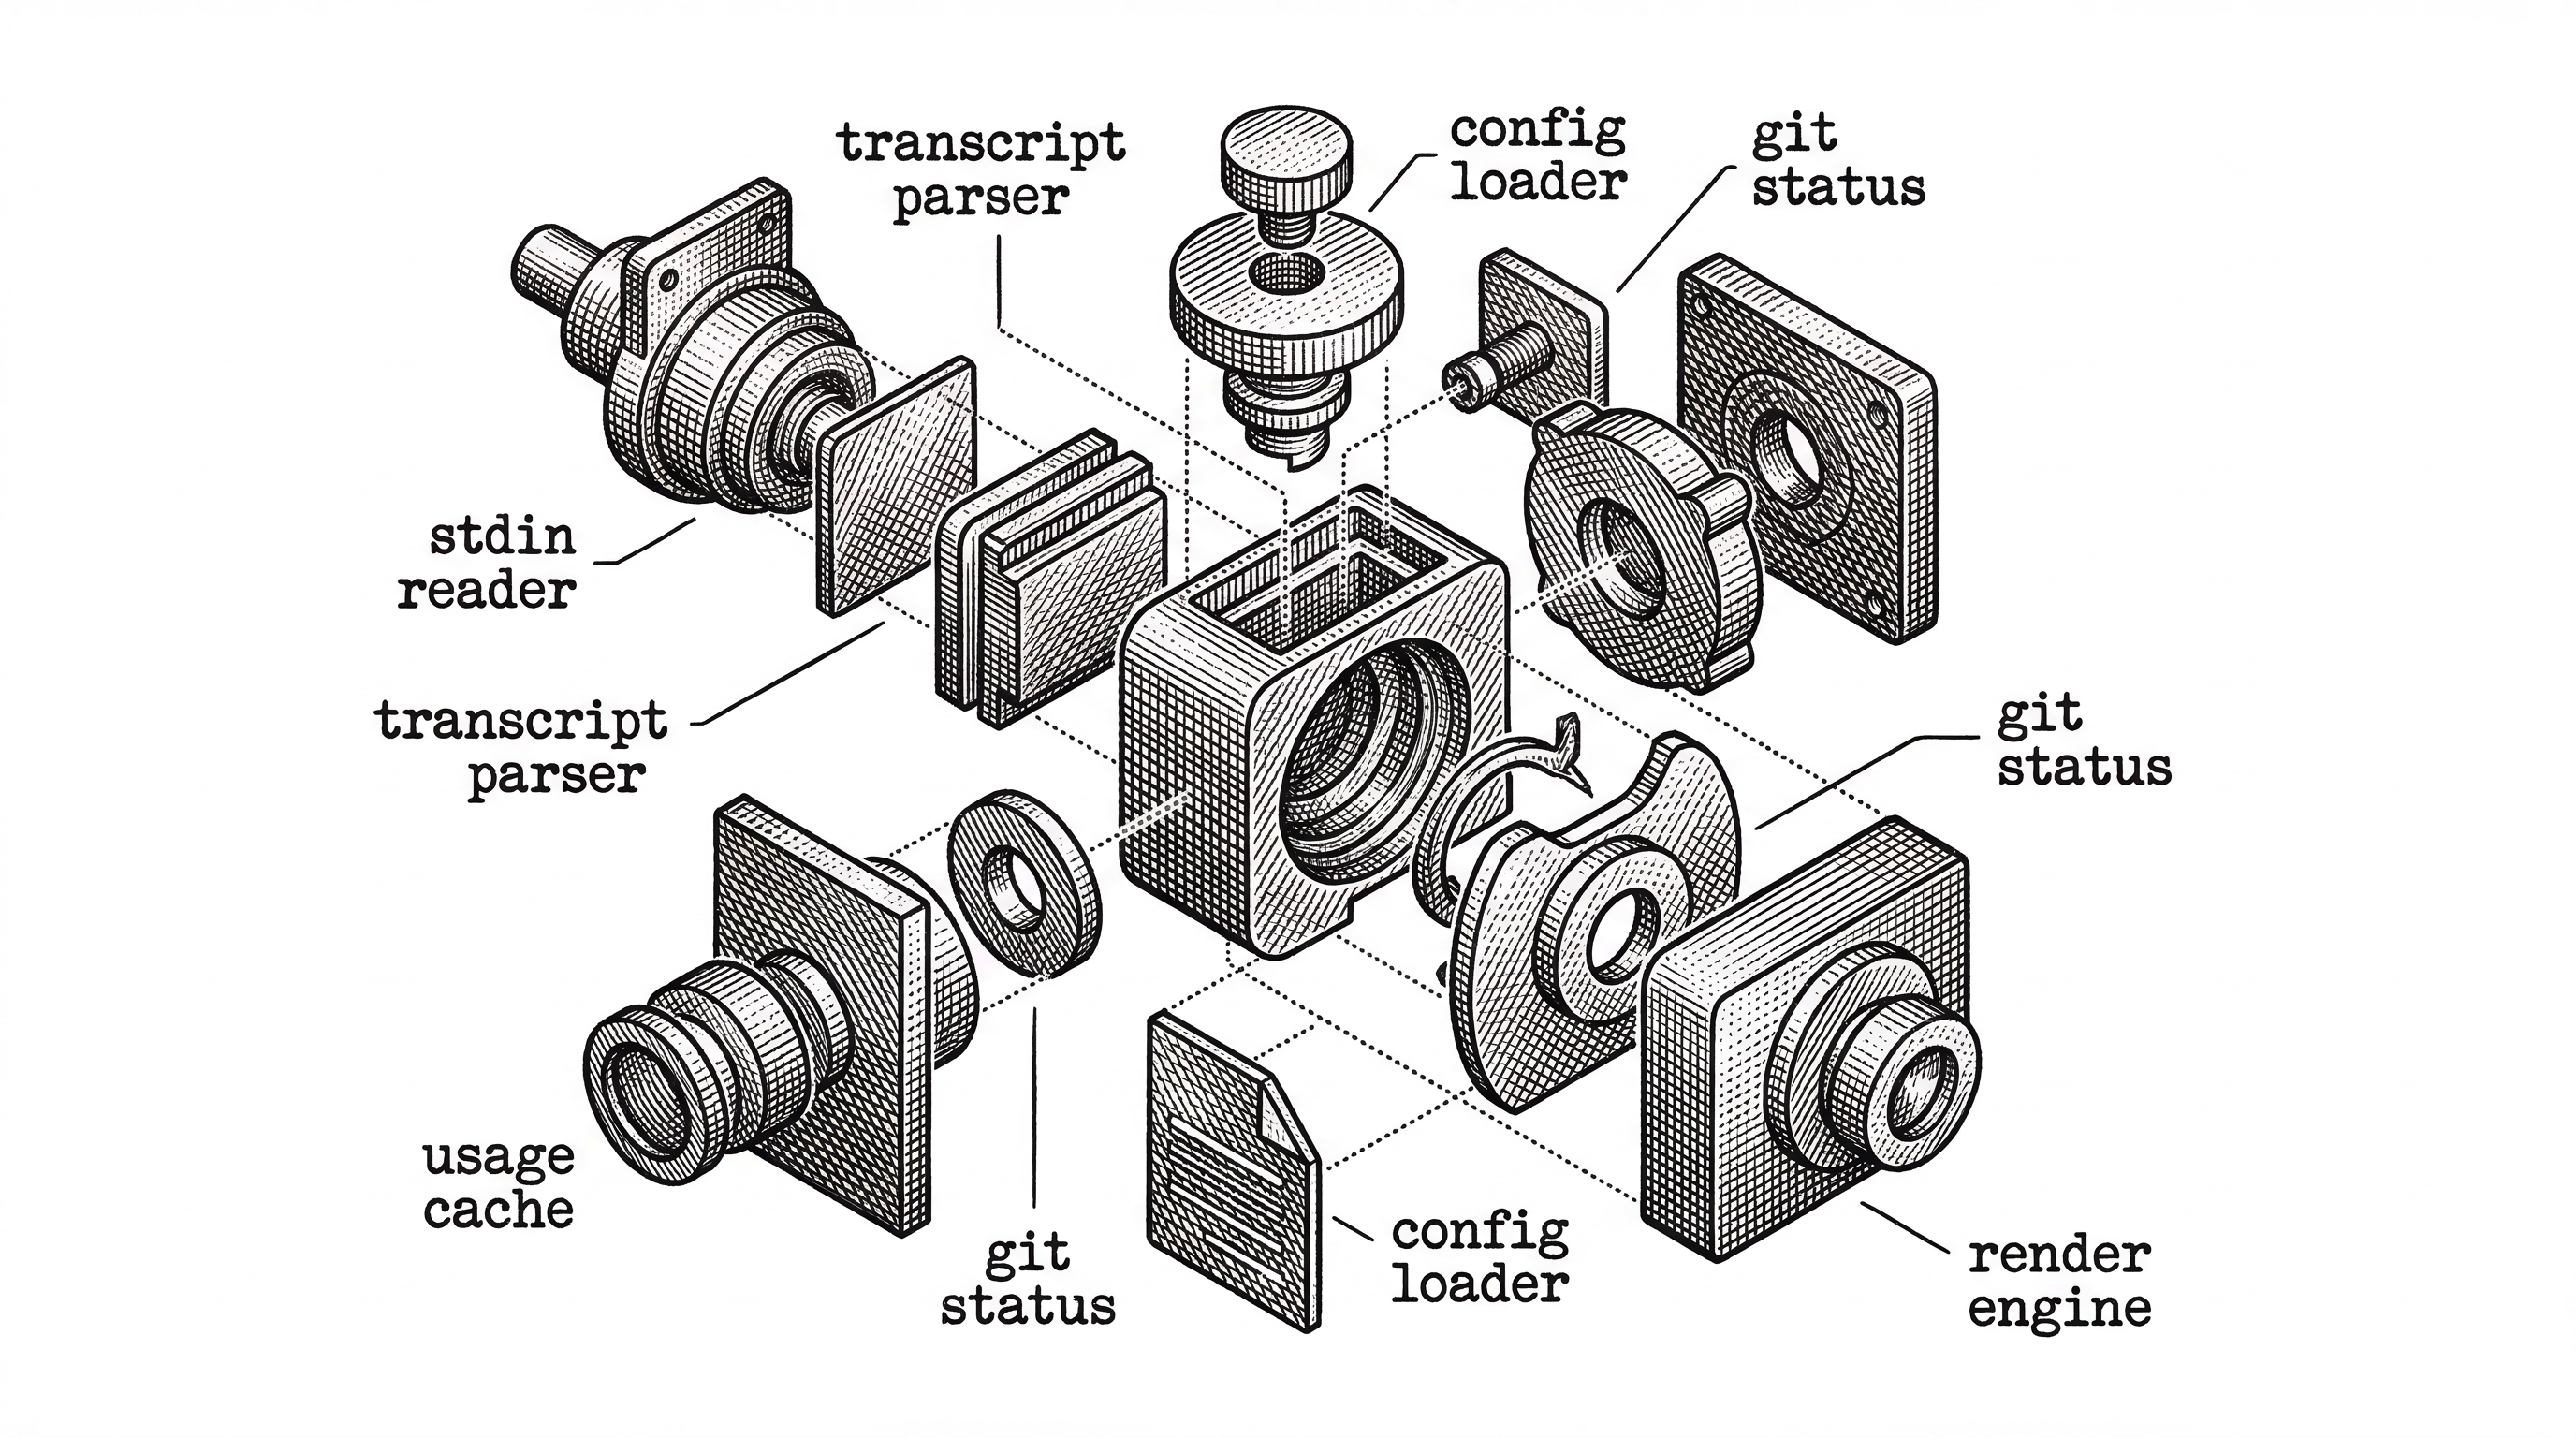
index.ts is the entry point. It defines a main() function with dependency injection for every external call. This makes the entire pipeline testable without mocking globals. Read stdin, parse transcript, count configs, get git status, get usage, load config, render. That is the entire flow.
types.ts defines the contract. StdinData, ToolEntry, AgentEntry, TodoItem, UsageData, and RenderContext are the core types. The RenderContext object is the single bag of state that the renderer receives. No globals. No side channels.
transcript.ts handles the JSONL parsing. It processes tool_use blocks by name, extracting file paths for Read/Write/Edit, patterns for Glob/Grep, and truncated commands for Bash. Agent spawns (Task tool calls) get separate tracking. TodoWrite and TaskCreate/TaskUpdate events maintain a live task list.
usage-api.ts is the most complex file, and for good reason. It handles OAuth credential discovery across macOS Keychain (with account-scoped lookups), Linux credential files, proxy configuration (HTTPS_PROXY, ALL_PROXY, HTTP_PROXY with NO_PROXY bypass), token refresh edge cases, disk-based caching with file locking, and rate limit backoff. At roughly 800 lines, it is the single largest source file. This is the kind of code that looks simple until you consider every environment it needs to run in.
The Render Pipeline
The render system deserves its own section because it solves a problem most terminal tools ignore: real Unicode width calculation.
Terminal columns are not character counts. A CJK character takes two columns. An emoji with a ZWJ sequence takes two columns. A combining mark takes zero columns. ANSI escape codes take zero columns. Getting this wrong means your bars overflow or your lines wrap in the wrong place.
Claude HUD uses Intl.Segmenter for grapheme clustering, then walks each grapheme to compute its visual width. The isWideCodePoint() function covers Hangul Jamo, CJK unified ideographs, fullwidth forms, and emoji ranges. The wrapLineToWidth() function splits lines at separator boundaries (| and │) before truncating, so the model badge [Opus | Max] stays together even in narrow terminals.
Two layout modes are available. Expanded mode places each element on its own line, with configurable ordering via the elementOrder array. Compact mode condenses everything into a single line. Both modes respect terminal width and wrap gracefully.
Configuration Without Complexity
The /claude-hud:configure command offers three presets. Full shows everything: tools, agents, todos, git, usage, duration. Essential shows activity lines plus git status. Minimal shows just the model name and context bar.
After picking a preset you can toggle individual elements. The configuration lives in ~/.claude/plugins/claude-hud/config.json. Manual edits are preserved across configure runs, which matters for power users who tune color thresholds or custom element ordering.
| Preset | Lines | Shows | Best For |
|---|---|---|---|
| Full | Up to 5 | Context, usage, tools, agents, todos, git, duration | Long sessions with subagents |
| Essential | 2-3 | Context, usage, git, activity lines | Daily coding with awareness |
| Minimal | 1 | Model name, context bar | Small terminals, quick tasks |
The context display supports three modes: percent (45%), tokens (45k/200k), and remaining (55% left). Colors are configurable per semantic state: green for healthy, yellow for warning, red for critical, bright blue for usage, bright magenta for usage warning. Seven color names are supported.
The Competitive Landscape
Claude HUD is not the only statusline tool. The ecosystem has grown fast in 2026.
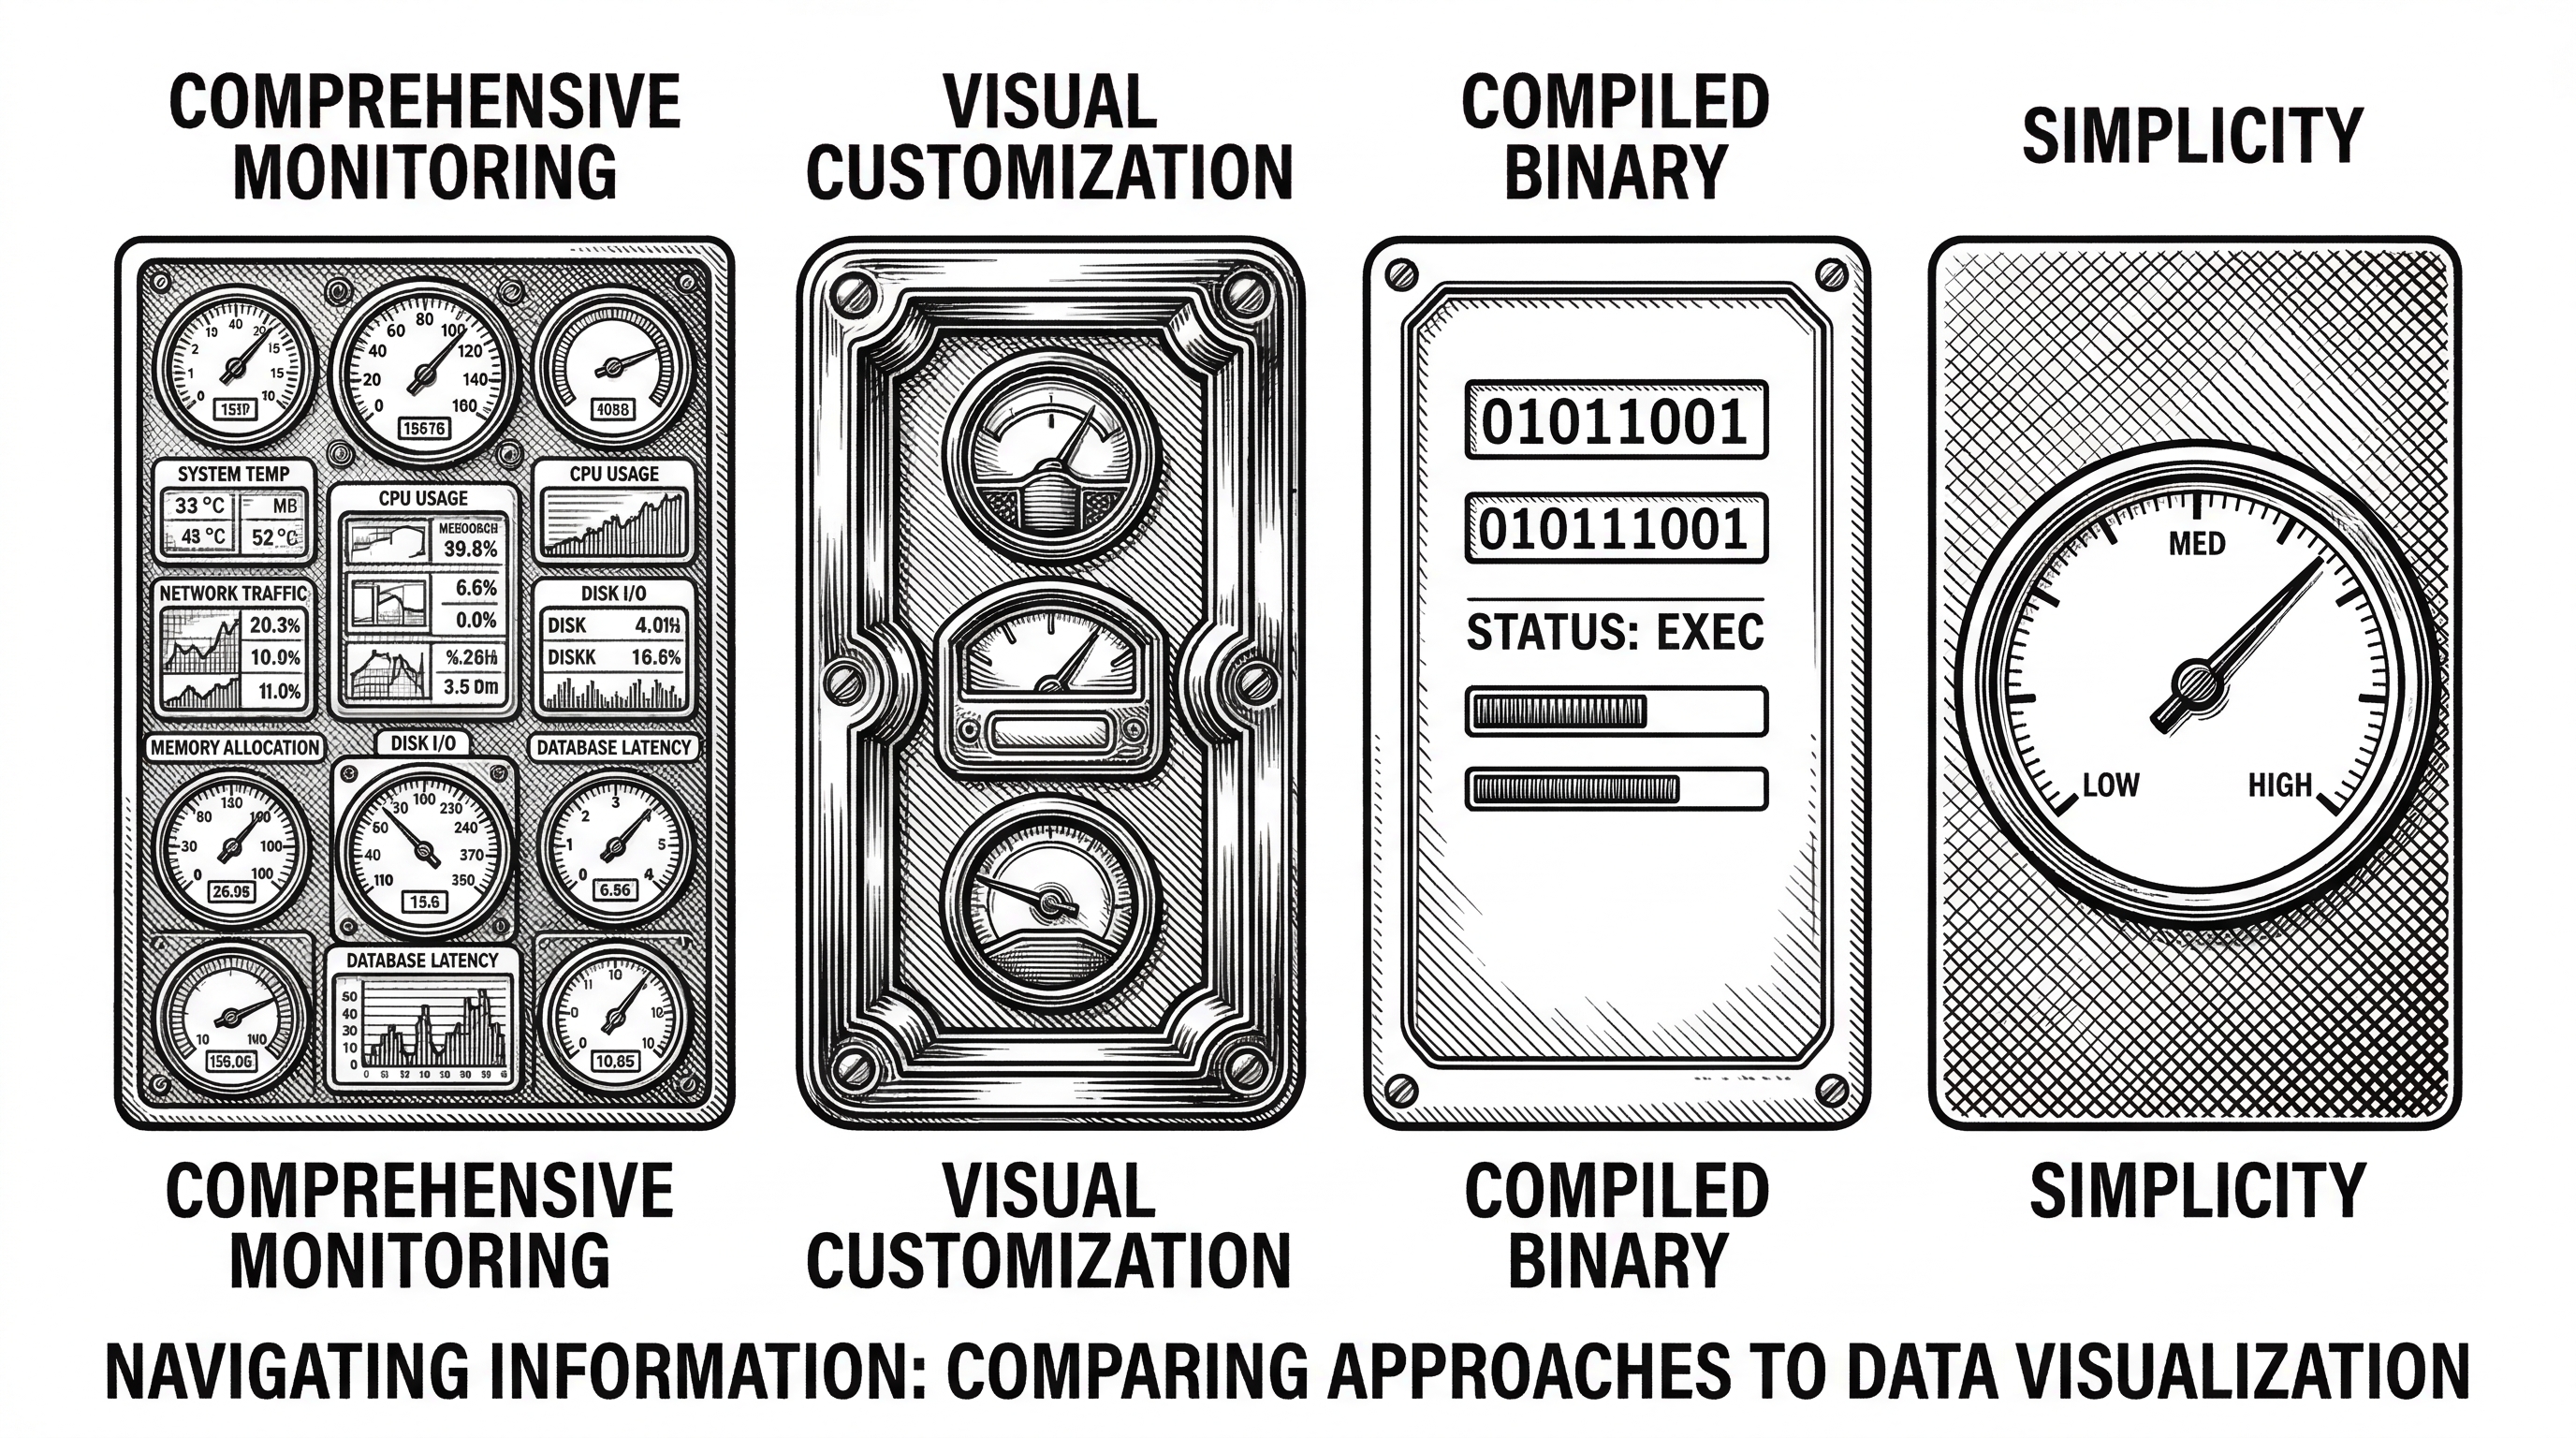
ccstatusline by sirmalloc offers Powerline-style themes, multiple visual styles, and extensive cosmetic customization. It targets users who want their terminal to look polished. Claude HUD targets users who want to see what is happening.
CCometixLine by Haleclipse is written in Rust. It provides context tracking and git status with the performance characteristics you would expect from a compiled binary. But it lacks the transcript parsing for tool/agent/todo visibility.
claude-statusline by hell0github focuses on cost tracking and session reset times. It is lightweight and single-purpose.
| Feature | Claude HUD | ccstatusline | CCometixLine | claude-statusline |
|---|---|---|---|---|
| Context health | Native tokens + bar | Percentage + bar | Percentage | Percentage |
| Tool activity | Live tracking | No | No | No |
| Agent tracking | Subagent status | No | No | No |
| Todo progress | Real-time | No | No | No |
| Rate limits | 5h + 7d bars | Session cost | No | Reset timer |
| Dependencies | Zero | npm packages | Rust crate | Minimal |
| Stars | 5,800+ | ~800 | ~300 | ~200 |
Claude HUD's differentiator is the transcript parsing. Reading stdin for context percentages is table stakes. Parsing the JSONL transcript to show live tool calls, agent trees, and task progress is what sets it apart. That is why it has 7x the stars of its nearest competitor.
Why Usage Visibility Changes Behavior
The rate limit display deserves special attention because it solves a behavioral problem, not just a technical one.
Claude Pro and Max plans have rolling windows. Use too much in 5 hours and you hit a wall. Use too much over 7 days and you hit a longer wall. Without visibility, developers either ration conservatively (leaving capacity unused) or blast through limits (losing 30 minutes to an hour of blocked time).
Claude HUD shows both windows simultaneously. The 7-day bar only appears when you exceed a configurable threshold (default 80%). Reset countdown timers tell you exactly when capacity returns. This turns rate limiting from a surprise into a resource you manage.
Context █████████░ 85% | Usage ████████░░ 78% (42m / 5h) | ██████████ 92% (1d 8h / 7d)That single line tells you: your context is getting hot, your 5-hour window resets in 42 minutes, and your 7-day usage is critically high. You can make an informed decision about whether to push through or pause.

"The idea came from frustration. I kept running into context limits mid-task with no warning. The statusline API was right there, and I thought: why isn't anyone showing the stuff that actually matters?"
Engineering Decisions That Matter
Several design choices in Claude HUD reveal a thoughtful approach to plugin development.
Process-per-render model
The plugin runs as a new Node.js process every 300ms. This sounds expensive but it is the correct trade-off. A long-running process would need to handle stdin reconnection, file descriptor leaks, and graceful shutdown. A fresh process gets clean state every time. The startup cost is negligible because there are zero npm dependencies to load.
Dependency injection in main()
The main() function accepts an overrides object for every external dependency: readStdin, parseTranscript, getUsage, getGitStatus, loadConfig, render, and even the clock (now()). This makes the entire data pipeline testable with pure functions. No mocking libraries needed.
Disk-based usage cache
Since there is no persistent process, usage API responses cache to disk. The caching layer handles lock files (with stale lock recovery), TTL expiration, rate limit backoff with Retry-After parsing, and concurrent access from multiple Claude Code sessions. This is file-system-level coordination for what looks like a simple statusline.
Grapheme-aware rendering
Most terminal tools count characters. Claude HUD counts visual columns using Intl.Segmenter and Unicode-aware width tables. This prevents broken layouts when file paths contain CJK characters, branch names include emoji, or ANSI escape codes shift alignment.

The Plugin Ecosystem Signal
Claude HUD's rapid adoption tells us something about the Claude Code ecosystem. When Anthropic introduced the plugin marketplace and statusline API, they created a surface area for community innovation. Claude HUD is the proof that the surface area was well-chosen.
The plugin model works because it is narrow. A statusline plugin receives JSON on stdin and writes text to stdout. That constraint eliminates an entire class of integration bugs. The plugin cannot crash Claude Code. It cannot corrupt the conversation. It cannot intercept tool calls. It just reads and displays.
This is the same design philosophy that made Unix pipes powerful. Small tools with clean interfaces compose into systems more capable than any monolith. Claude HUD is a filter in the Unix sense: data in, display out.
What Could Come Next
The CHANGELOG shows an active development pace. Ten releases in under three months, each addressing real user issues: proxy support, Windows compatibility, multi-account credential handling, narrow terminal wrapping.
The open issues and discussions suggest several directions. Historical context usage trends across sessions. Cost estimation based on token consumption patterns. Team dashboards that aggregate usage across developers. Integration with external monitoring tools via OpenTelemetry.
The architecture supports all of these. The RenderContext interface is the natural extension point. Add a new data source, populate a new field, add a new render line. The pattern is established.

Should You Install It?
If you use Claude Code for more than quick questions, yes. The context visibility alone justifies the three-command install. Knowing that you are at 75% context before you start a large refactor changes the decision you make. Knowing that your 5-hour rate limit resets in 12 minutes changes whether you wait or switch tasks.
If you run subagents, the agent tracking line becomes essential. Seeing which subagent is running, what model it uses, and how long it has been active gives you the same oversight a manager has over a team. Without it, subagents are fire-and-forget with no visibility until they either succeed or fail.
The zero-dependency design means there is almost no risk in trying it. Nothing to uninstall if you do not like it. Nothing that could conflict with your existing setup. It is a read-only observer of your session state, and that is exactly what a good instrument should be.